-
AutoCount Accounting Features
-
- Approval Workflow
- Audit Trail
- Auto Save in Draft Folder
- AutoCount Contra Account
- AutoCount License Setting Guide
- Deposit Tracking & Management
- Documents Numbering Format
- Full Transfer and Partial Transfer
- Import Data to AutoCount Accounting Using Excel
- Informative Charts and Analytical Data
- Layout Customization
- Multi Pricing
- Sales and Services Tax
- Schedule Backup
- Search Lookup Edit
- View Documents Flow
- AutoCount Feature Stock Take
- Column Chooser
- Show Remaining (3) Collapse
-
AutoCount Cloud Accounting
-
AutoCount E-Invoice
-
AutoCount HRMS User Guide
-
AutoCount Modules
-
- Activity Stream
- Advanced Financial Report
- Advanced Item
- Advanced Multi-UOM
- Advanced Quotation Module
- Basic Multi-UOM
- Budget Module
- Consignment
- Filter By Salesman
- FOC Quantity
- Formula
- Item Batch
- Item Package
- Landing Cost
- Multi-Currency
- Multi-Dimensional Analysis
- Multi-Location
- Project Account
- Recurrence
- Remote Credit Control Module
- Stock Assembly
- User Defined Fields (UDF)
- AutoCount SST Hidden Functions
- AutoCount SST Submission - Service Tax
- AutoCount Scripting Module User Guide
- AutoCount Bonus Point Module User Guide
- Show Remaining (11) Collapse
-
AutoCount Plugins
-
- Fixed Assets Management
- Goldsmith
- TD Ordering Mobile Apps
- TD Stock Mobile Apps
- Universal Import Plugin
- DMS Import Plugin
- AutoCount Item Scope Plugin
- AutoCount Easy Knock Off Plugin
- AutoCount Pick List Plugin User Guide
- AutoCount Agent Validation Plugin User Guide
- AutoCount Barcode Generator Plugin User Guide
- AutoCount Bill Remark Plugin User Guide
- AutoCount Easy Batch Number Entry Plugin User Guide
- AutoCount Recurring Invoice Plugin User Guide
- AutoCount Easy Photo 2.0 User Guide
- AutoCount Pain Tracker User Guide
- AutoCount Credit Memo Plugin User Guide
- Show Remaining (2) Collapse
-
- AutoCount Easy Recurrence Plugin
- AutoCount Recurring Billing Plugin
- Event Management System
- AutoCount To-Do List Plugin
- AutoCount AutoBank Reconciliation Plugin
- Intercompany Billing Plugin User Guide
- AutoCount Basket Plugin User Guide
- Lead Management 2.0 Plugin
- AutoCount Service Contract Plugin User Guide
- Autocount Repacking Plugin
- AutoCount Scale Barcode Plugin User Guide
- AutoCount Progressive Billing
- AutoCount Optical Plugin
- AutoCount Meter Reading Plugin User Guide
- AutoCount Car Tint Film Plugin
- AutoCount Leasing Plugin User Guide
- AutoCount Integrator Plugin
- AutoCount Procurement Planning Plugin
- Show Remaining (3) Collapse
-
-
Form Template
-
Report Template
-
- Advance Quotation
- Cash Sale
- Consignment
- Consignment Movement
- Credit Note
- Debit Note
- Delivery Order
- FOC Quantity Analysis By Document Report
- Invoice
- Item Package Sales Report
- Monthly Sales Analysis
- Outstanding Sales Order Listing
- Profit And Loss Of Documents
- Quotation
- Sales Agent Contribution Report
- Sales Order
- Top/Bottom Sales Ranking
- Show Remaining (2) Collapse
-
- Available Stock Status Report
- Expired Item Batch Listing
- Inventory Physical Worksheet
- Stock Adjustment
- Stock Aging Report
- Stock Assembly
- Stock Assembly Order
- Stock Balance By Location
- Stock Balance Report
- Stock Card Report
- Stock Disassembly
- Stock Issue
- Stock Item Profit Margin
- Stock Movement Report
- Stock Receive
- Stock Take
- Stock Transfer
- Stock Write Off
- Show Remaining (3) Collapse
AutoCount Module: Multi-Dimensional Analysis Module
Why Choose the AutoCount Multi-Dimensional Analysis Module for Business Reporting?
The AutoCount Multi-Dimensional Analysis Module makes business reporting faster, easier, and more accurate. It allows users to analyze sales, purchases, and performance data directly from the accounting system without relying on complex Excel reports. With pivot-style reporting, users can easily view data by customer, supplier, product, category, or time period. Fully integrated with AutoCount Accounting, this module ensures real-time, reliable insights—helping business owners, managers, and finance teams identify trends, track performance, and make smarter, data-driven decisions with confidence.
AutoCount Multi-Dimensional Analysis Module Video Guide
These video provides a comprehensive understanding of the AutoCount Multi-Dimensional Analysis Module, detailing its features and how to customize reports like a pro.
- AutoCount Multi-Dimensional Analysis (EN)
Multi-Dimensional Analysis Setup
Integration & Multi-Dimensional Analysis Setup
- AutoCount Multi-Dimensional Analysis (CN)
多维分析设置
集成与多维分析设置
What is the AutoCount Multi-Dimensional Analysis Module?
Firstly, the AutoCount Multi-Dimensional Analysis Module is a comprehensive analytics tool that helps businesses gain valuable insights into their data. In addition, it includes the following modules and plugins:
Multi-Dimensional Sales Analysis
Analyze sales trends, track profitability, and monitor performance metrics.
Multi-Dimensional Purchase Analysis
Understand purchasing trends and evaluate supplier performance.
In addition, advanced plugins add even more capabilities, including template-saving and UDF (User-Defined Field) analysis for detailed customization. As a result, with these tools, businesses can make data-driven decisions quickly and efficiently.
Step-by-Step Guide: How to Use the AutoCount Multi-Dimensional Analysis Module
1.Start with the Basics
- Firstly, open the AutoCount Multi-Dimensional Analysis Module and navigate to Sales > Multi-Dimensional Sales Analysis.
- Next, load the Default Layout to reset any previous configurations and avoid errors.

2. Set Up Your Key Parameters
- Select Date Range: Define your analysis period, from months to multiple years.
- Choose Document Types: Filter documents such as invoices, sales orders, or debit notes for precise analysis.

3. Customize Your Data View
- Use the module’s checkboxes to include key metrics .
- Tick the “Exclude Post to G/L” option to focus on unposted documents.

Data Area
Select the data area by clicking the desired options (if needed). For example, to view profit by item or customer, tick ‘Show Local Profit’ or to analyze agents or items, ticking ‘Show Local Sub Total’ is sufficient.
4. Design Your Report Layout
- Drag and drop fields into rows and columns to create a customized report.
- Use the “Top Value Count” feature to display top-performing products, agents, or customers.

5. Export and Save Your Analysis
- If you satisfied with your analysis, click ‘Hide Option’ to see clearly.
- Next, click ‘Preview’ to preview your final report.
- After that, save layouts for recurring analysis to save time and ensure consistency.

- Export it to Excel, PDF, or other formats for further use.

OR
Strongly Suggested:
- Use Export function at above.

6.Their Differences
- If you need structured, professional-looking reports, especially for Excel, exporting from above is the better choice as it retains your customized formatting for easier review and sharing.

Pro Tips for Maximizing the AutoCount Multi-Dimensional Analysis Module
1. Sorting and Top Value Features
- This feature allows you to sort data and highlight the most important records. You can:
Find Top 10 Customers by
Revenue
Firstly, focus on your best customers to maintain strong relationships or upsell products.
Identify Low-Profit
Products
Secondly, highlight the 5 items with the smallest profit margins to reassess pricing or find ways to reduce costs.
2. Analyze Pending Documents
- Firstly, tick the “Exclude Post to G/L” option.
- Secondly, view pending documents, like sales orders or unposted invoices.
- The “Exclude Post to G/L” function focuses only on unposted documents, like invoices or orders that aren’t finalized. This helps:
- Ensure no pending transactions are missed.
- Track incomplete orders or invoices before they’re officially recorded in accounts.
How to Use:
- Tick the “Exclude Post to G/L” option.
- View pending documents, like sales orders or unposted invoices.
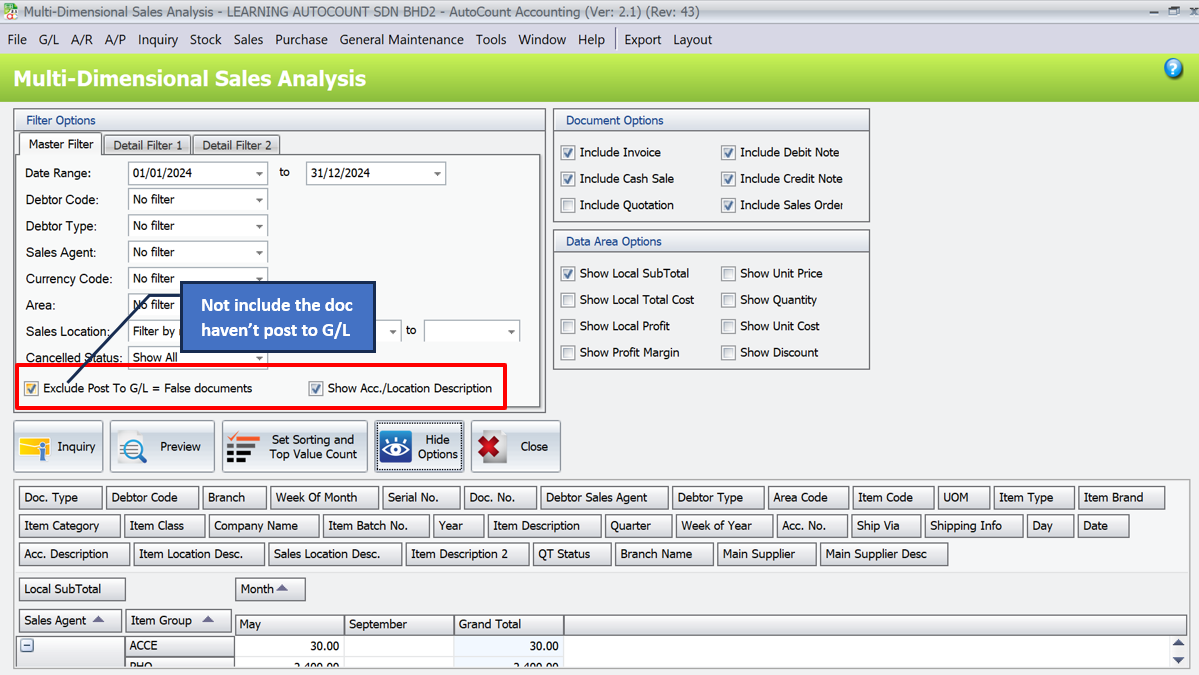
Show Acc./Location Description
It for analyzes account descriptions and identifies the accounts they belong to.
Example : View asset disposals in account descriptions for sales of assets.
Advanced Plugins for the AutoCount Multi-Dimensional Analysis Module
For businesses with advanced requirements, the AutoCount Multi-Dimensional Analysis Module offers plugins that elevate its functionality. These include:

Multi-Dimensional POS Analysis-Advanced Plugin
Enhance your retail analytics with detailed POS performance insights. It helps you to know your sales data in detail, including special fields you can customize for your business.

Multi-Dimensional Stock Analysis Plugin
Optimize inventory management with in-depth stock tracking. It is process of analyzing stock data from multiple dimensions or perspectives to gain insights into stock performance, inventory management, and related metrics.

Multi-Dimensional Sales Analysis-Advanced Plugin
Analyze sales trends, profitability, and performance with advanced customization, templates, and UDFs for deeper, efficient decision-making insights.
Why The AutoCount Multi-Dimensional Analysis Module Is Better Than Excel?
Excel is a reliable tool, but the AutoCount Multi-Dimensional Analysis Module offers superior capabilities by integrating with accounting systems and providing advanced features for streamlined reporting and analytics.
Seamless Accounting Integration
Customizable Filtering Options
Comprehensive Document Options
Visualized Data Insights
Advanced Reporting Tool
User-friendly Interface
Conclusion
The AutoCount Multi-Dimensional Analysis Module is a game-changer for businesses looking to gain deeper insights into their operations. Its ability to integrate sales, inventory, and financial data into customizable reports offers unparalleled flexibility and precision. By streamlining reporting and enhancing decision-making, this tool empowers businesses to stay ahead in today’s competitive landscape.
Frequently Asked Questions
Do I need advanced plugins to use this module?
No, the core features of the AutoCount Multi-Dimensional Analysis Module are powerful enough for most businesses. Advanced plugins add functionality like UDF analysis and template-saving for more complex requirements.
Can I export reports to Excel?
Yes, you can easily export data to Excel, PDF, and other formats. Excel exports are formatted neatly for immediate use.
Is the tool easy to set up?
Absolutely! The intuitive design ensures that even first-time users can navigate the module with ease.
Can I analyze unposted documents?
Yes, the module allows you to include or exclude unposted documents by enabling the “Exclude Post to G/L” option.
Interested in Getting AutoCount for your Business?
Contact our sales team today to explore pricing options and get started with the perfect solution for you.