
-
AutoCount Accounting Features
-
- Approval Workflow
- Audit Trail
- Auto Save in Draft Folder
- AutoCount Contra Account
- AutoCount License Setting Guide
- Deposit Tracking & Management
- Documents Numbering Format
- Full Transfer and Partial Transfer
- Import Data to AutoCount Accounting Using Excel
- Informative Charts and Analytical Data
- Layout Customization
- Multi Pricing
- Sales and Services Tax
- Schedule Backup
- Search Lookup Edit
- View Documents Flow
- AutoCount Feature Stock Take
- Column Chooser
- Show Remaining (3) Collapse
-
AutoCount Cloud Accounting
-
AutoCount E-Invoice
-
AutoCount HRMS User Guide
-
AutoCount Modules
-
- Activity Stream
- Advanced Financial Report
- Advanced Item
- Advanced Multi-UOM
- Advanced Quotation Module
- Basic Multi-UOM
- Budget Module
- Consignment
- Filter By Salesman
- FOC Quantity
- Formula
- Item Batch
- Item Package
- Landing Cost
- Multi-Currency
- Multi-Dimensional Analysis
- Multi-Location
- Project Account
- Recurrence
- Remote Credit Control Module
- Stock Assembly
- User Defined Fields (UDF)
- AutoCount SST Hidden Functions
- AutoCount SST Submission - Service Tax
- AutoCount Scripting Module User Guide
- AutoCount Bonus Point Module User Guide
- AutoCount Service Management Plugin User Guide
- Show Remaining (12) Collapse
-
AutoCount Plugins
-
- Fixed Assets Management
- Goldsmith
- TD Ordering Mobile Apps
- TD Stock Mobile Apps
- Universal Import Plugin
- DMS Import Plugin
- AutoCount Pick List Plugin User Guide
- AutoCount Credit Memo Plugin User Guide
- AutoCount Lock Price Plugin
- AutoCount Progressive Billing
- AutoCount Easy Recurrence Plugin
- Batch Update Unit Price Plugin
- AutoCount Production order
- AutoCount Car Tint Film Plugin
-
- Event Management System
- AutoCount To-Do List Plugin
- AutoCount AutoBank Reconciliation Plugin
- Intercompany Billing Plugin User Guide
- Lead Management 2.0 Plugin
- AutoCount Service Contract Plugin User Guide
- AutoCount Optical Plugin
- AutoCount Integrator Plugin
- AutoCount Procurement Planning Plugin
- Cage Management Plugin
- AutoCount Vehicle Plugin
- AutoCount Agent Validation Plugin User Guide
- AutoCount Barcode Generator Plugin User Guide
- AutoCount Easy Batch Number Entry Plugin User Guide
- Warranty 2.0 Plugin
- AutoCount Easy Photo 2.0 User Guide
- AutoCount Recurring Invoice Plugin User Guide
- AutoCount Scale Barcode Plugin User Guide
- AutoCount Recurrence Late Interest Plugin
- AutoCount Item Visibility Control
- AutoCount Bill Remark Plugin User Guide
- AutoCount Pain Tracker User Guide
- AutoCount Easy Payment
- AutoCount Easy Deposit Plugin
- AutoCount Easy Knock Off Plugin
- AutoCount Daily Collection Summary Plugin
- Timber Log Plugins
- Batch Transfer SODO Plugin
- AutoCount Vege Basket Plugin Guide
- AutoCount Fruit Basket Plugin Guide
- Referral Management Plugin
- AutoCount Migrator Plugin
- AutoCount Email & WhatsApp Plugin
- AutoCount Multi Company Knock Off Plugin
- AutoCount Advance Aging Format Plugin
- AutoCount Payment Request Plugin
- AutoCount Vehicle Master Plugin
- AutoCount Advance Deposit Plugin
- AutoCount IC Checker Plugin
- AutoCount RMA Plugin
- AutoCount Historical Outstanding DO Listing Plugin
- AutoCount Project Department Visibility Control Plugin
- AutoCount MRP Order Plugin
- AutoCount GridToExcel Plugin
- AutoCount Stock Availability Report Plugin
- AutoCount Batch Transfer SO DO Plugin
- AutoCount Centralized Kitchen Management Plugin
- SL AutoCount API
- AutoCount InterCompany Billing Plugin
- AutoCount Sales Commission Plugin
- AutoCount Advanced Credit Term Plugin
- AutoCount Advanced Stock Assembly Plugin
- AutoCount Shipment Plugin
- AutoCount Tour Plugin
- AutoCount Smart Analysis
- AutoCount Rental Management
- Show Remaining (41) Collapse
-
-
Form Template
-
Report Template
-
- Advance Quotation
- Cash Sale
- Consignment
- Consignment Movement
- Credit Note
- Debit Note
- Delivery Order
- FOC Quantity Analysis By Document Report
- Invoice
- Item Package Sales Report
- Monthly Sales Analysis
- Outstanding Sales Order Listing
- Profit And Loss Of Documents
- Quotation
- Sales Agent Contribution Report
- Sales Order
- Top/Bottom Sales Ranking
- Show Remaining (2) Collapse
-
- Available Stock Status Report
- Expired Item Batch Listing
- Inventory Physical Worksheet
- Stock Adjustment
- Stock Aging Report
- Stock Assembly
- Stock Assembly Order
- Stock Balance By Location
- Stock Balance Report
- Stock Card Report
- Stock Disassembly
- Stock Issue
- Stock Item Profit Margin
- Stock Movement Report
- Stock Receive
- Stock Take
- Stock Transfer
- Stock Write Off
- Show Remaining (3) Collapse
-
B2B ORDERING
-
AutoCount AI Agent
AutoCount Smart Analysis Plugin Setup Guide
Understanding Smart Sales Analysis Plugin
The AutoCount Smart Sales Analysis Plugin helps businesses analyze sales performance through interactive pivot reports. Users can filter sales data, customize report layouts, drill down into transaction details, add user-defined fields, export reports, and save reusable analysis criteria for faster reporting.
Benefits of Using the Smart Sales Analysis Plugin
Interactive Pivot Analysis
Advanced Sales Filtering
Customizable Report Layouts
Quick Report Export
Reusable Analysis Criteria
How AutoCount Smart Analysis Plugin Works
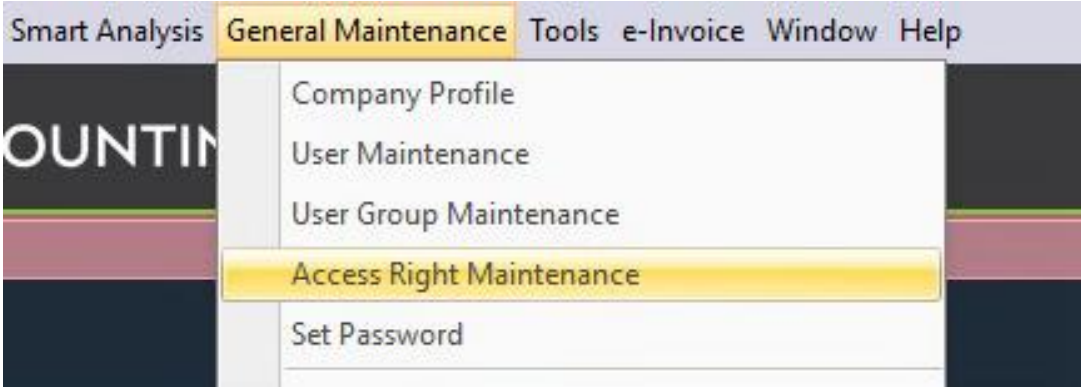
A. Access Rights
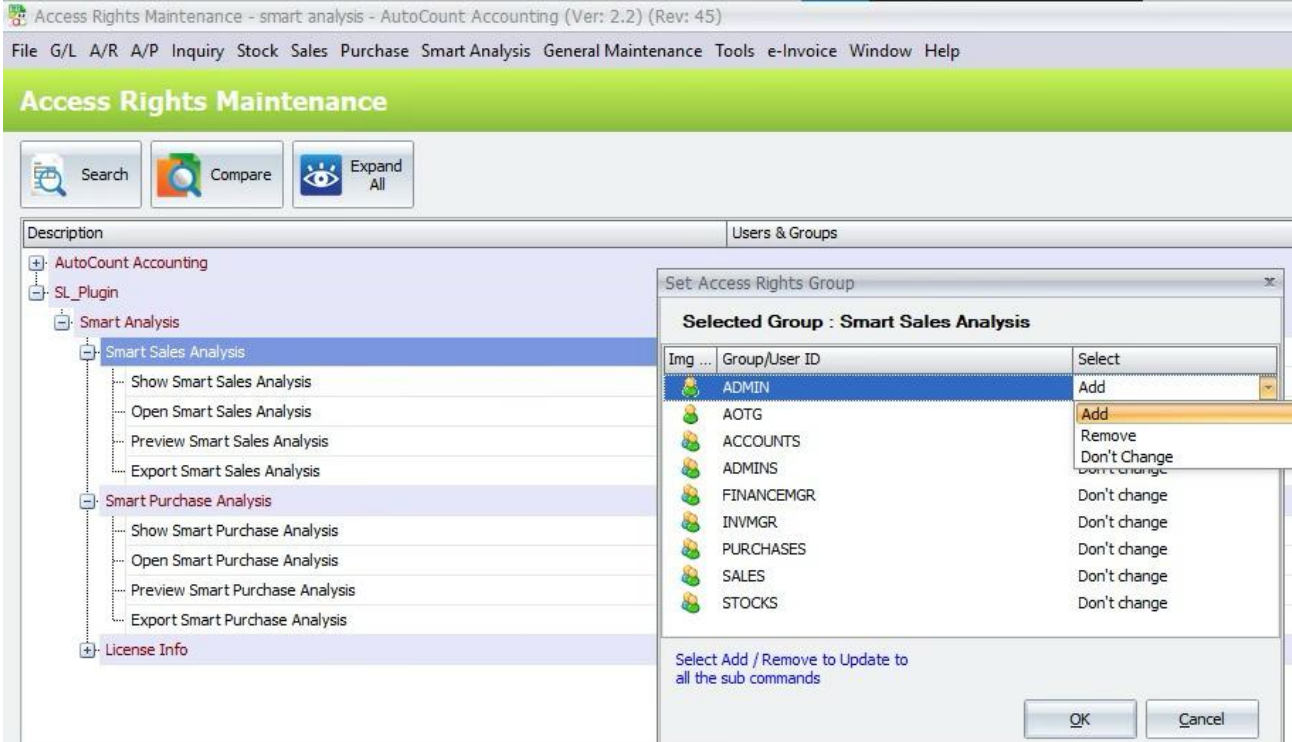
An administrator controls access to Smart Sales Analysis in AutoCount. Show and Open rights control access to the analysis screen. Preview and Export rights control the corresponding output actions.
- Open AutoCount access-right settings for the intended user or user group.
- Expand SL Plug-In > Smart Analysis > Smart Sales Analysis.
- Enable Show Smart Sales Analysis and Open Smart Sales Analysis for users who need the report.
- Enable Preview Smart Sales Analysis or Export Smart Sales Analysis when users need those actions, then save the access-right changes. The report also respects AutoCount data access. Cost-related fields are hidden when the user does not have the system View Cost right.
B. Run a Sales Analysis
Smart Sales Analysis combines selected sales document types into a pivot report. Choose a date range and report options, run Inquiry, then arrange the results for review.
- Open Smart Sales Analysis from the AutoCount menu.
- Set Date Range. The screen initially fills the first day of the current month and today.
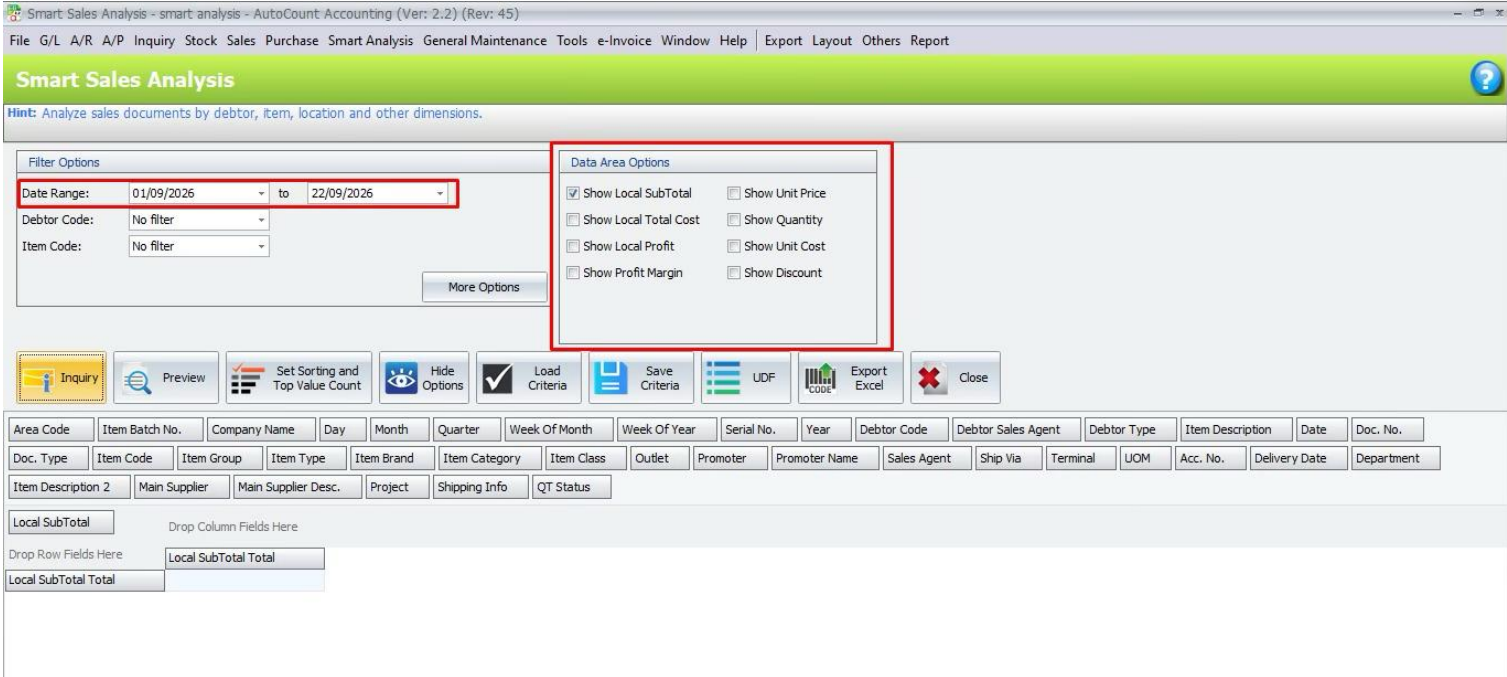
- Select at least one document type and one data area in More Options.
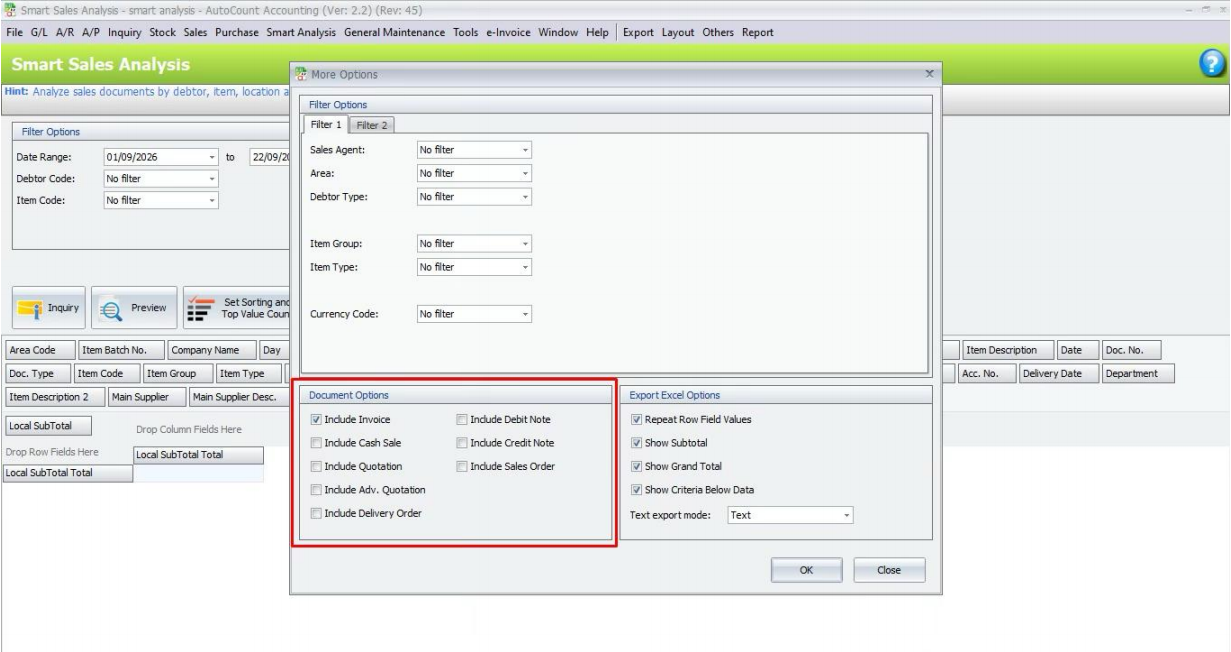
- Click Inquiry. Review the results in the pivot grid. If the date range is invalid, no document type is selected, or no data area is selected, the report displays a message and does not run the inquiry
C. Filter the Report
C.1 Basic and advanced filters
The basic filter view provides Date Range, Debtor Code and Item Code. Switch to Advanced Options to use the additional master and detail filters.
- In Smart Sales Analysis, enter the Date Range.
- In the basic view, select Debtor Code or Item Code when needed.
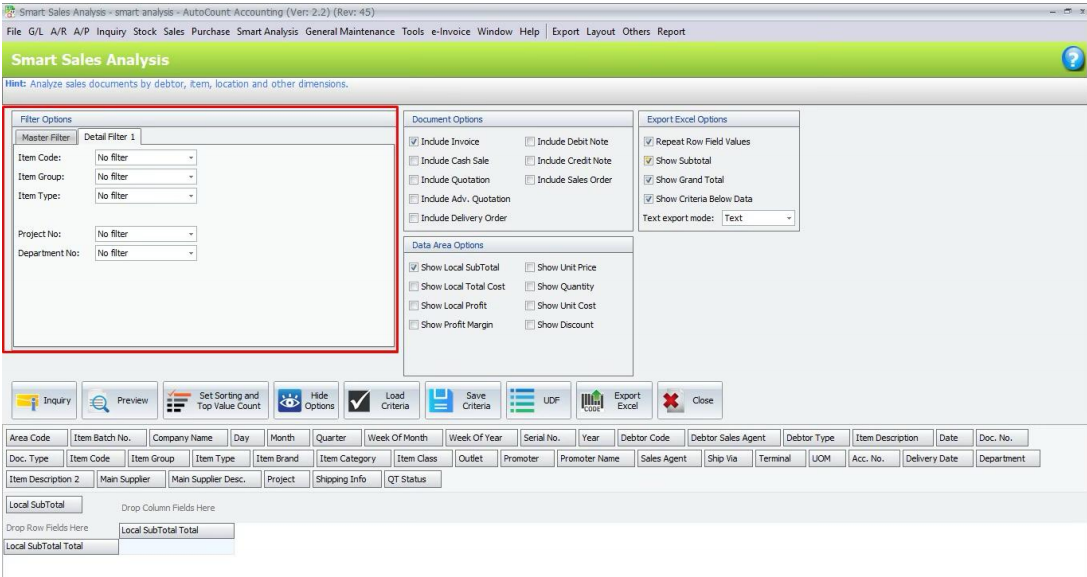
- Switch to Advanced Options to see the Master Filter, Detail Filter 1 and Detail Filter 2 groups.
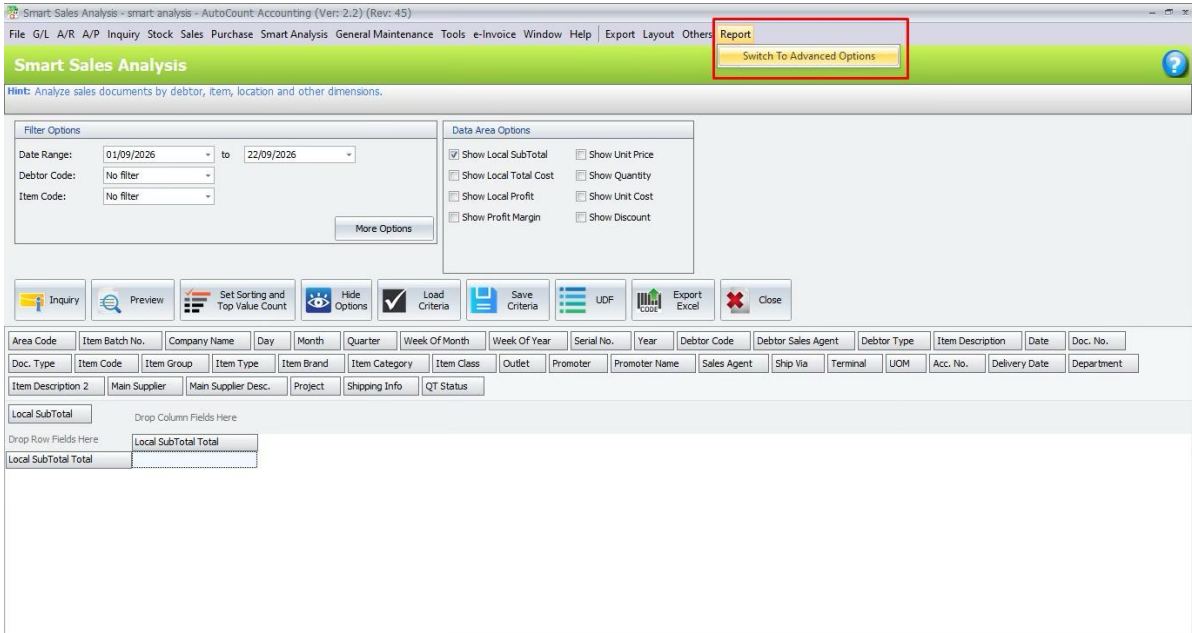
- Choose filter values for the report, then click Inquiry to refresh the pivot results.
– Master filters include Debtor Type, Sales Agent, Currency Code, Area and Sales Location.
– Detail filters include Item Group, Item Type, Location, Project No, Department No, Item Category, Item Brand and Item Class.
C.2 More Options
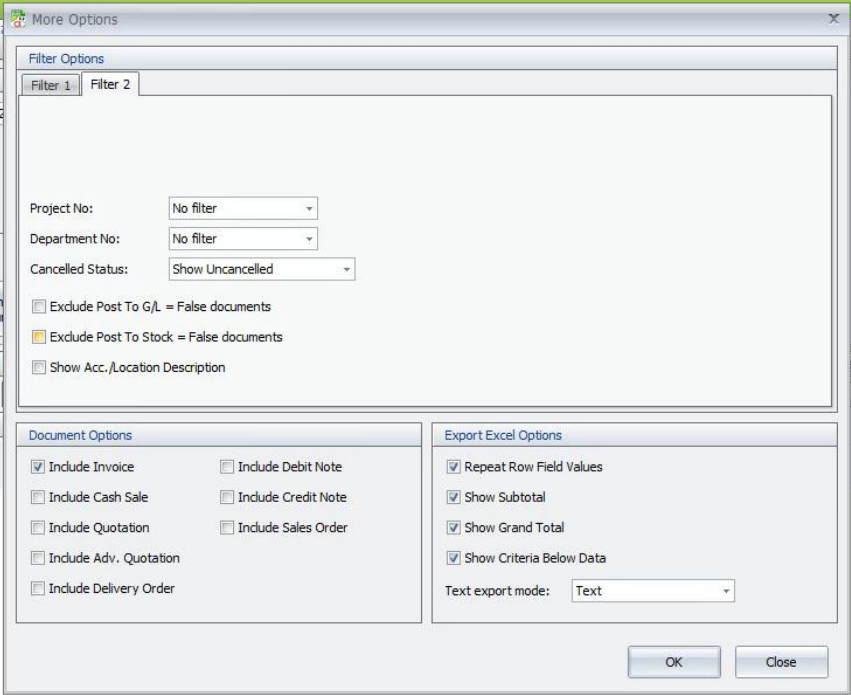
More Options contains additional filters and determines which documents and data areas are included in the inquiry.
- Click More Options.
- Set Cancelled Status, and apply any additional filters shown in Filter Options.
- Under Document Options, select the sales document types to include.
- Set any Export Excel Options, then click OK to apply the changes.
– Document types include Invoice, Debit Note, Cash Sale, Credit Note, Quotation, Sales Order, Adv. Quotation, POS and Delivery Order. Some options may be unavailable when the corresponding feature is not present.
– Measures include Local Sub-Total, Unit Price, Local Total Cost, Quantity, Local Profit, Unit Cost, Profit Margin, Discount, Sub-Total, FOC Quantity and Smallest Quantity. Cost-related choices depend on the user’s View Cost right.
D. Arrange and Explore Results
D.1 Change the pivot layout
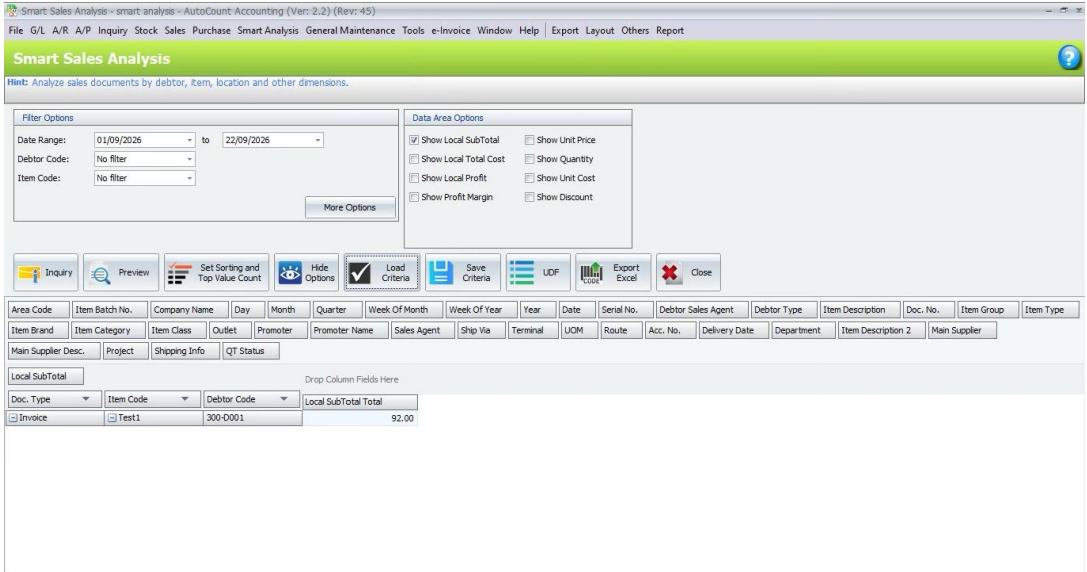
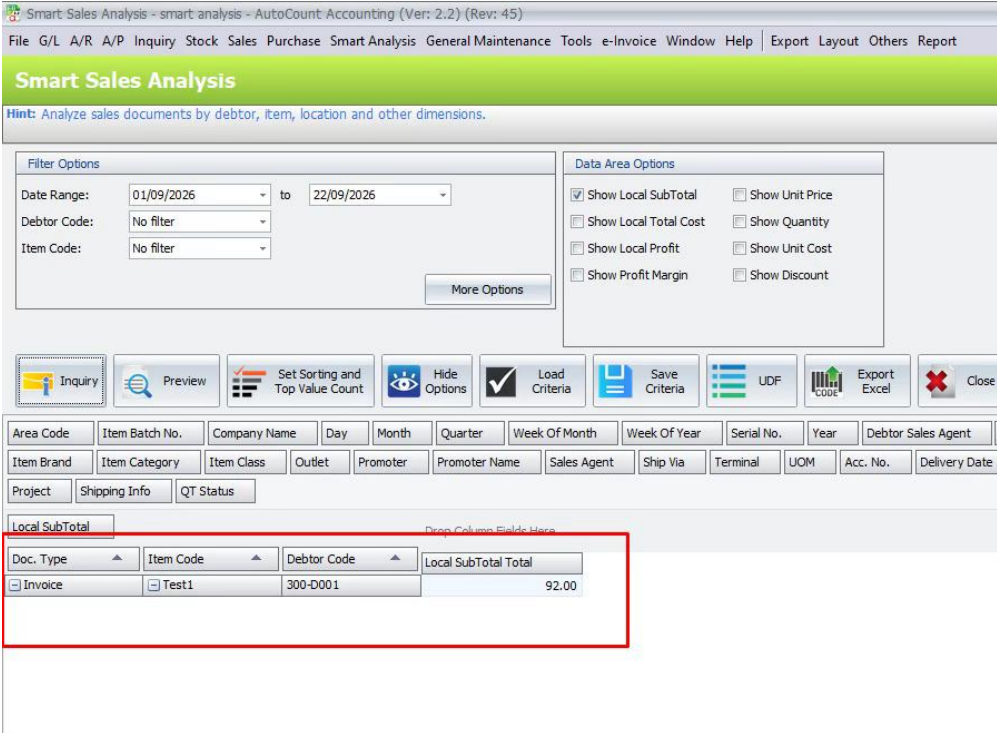
The pivot grid summarizes the selected records by dimensions and measures. Use its field areas to change how the report is grouped.
- Run Inquiry to populate the pivot grid.
- Add or remove available fields and arrange them in Filter, Row, Column or Data areas. Numeric fields can be used in the Data area.
- Expand or collapse a grouped row or column to change the level of detail.
- Run Inquiry again after changing report criteria to refresh the result set. The available fields depend on the document types, selected data areas, company schema and the user’s access rights.
D.2 Sort fields and limit values
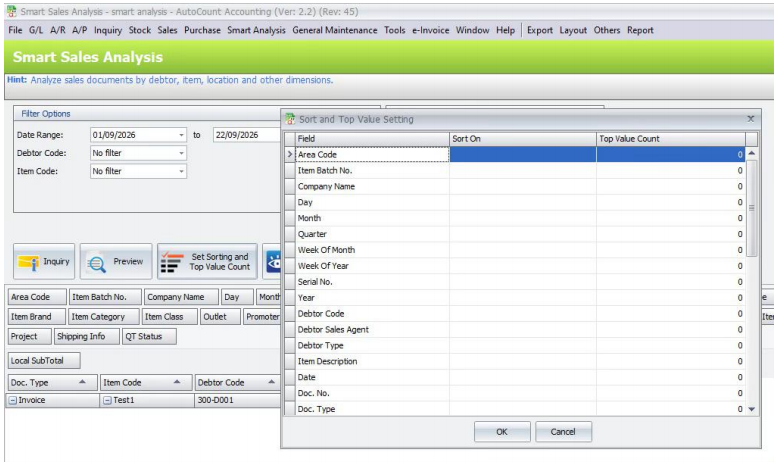
- Click Set Sorting and Top Value Count.
- Choose a sort measure for a visible pivot field.
- Enter a Top Value Count when you want to show only the highest values. A top-value count sorts the selected values in descending order.
- Click OK to apply the settings. The available sort measures depend on access rights. Fields that are not in the Data area are available in the setting list.
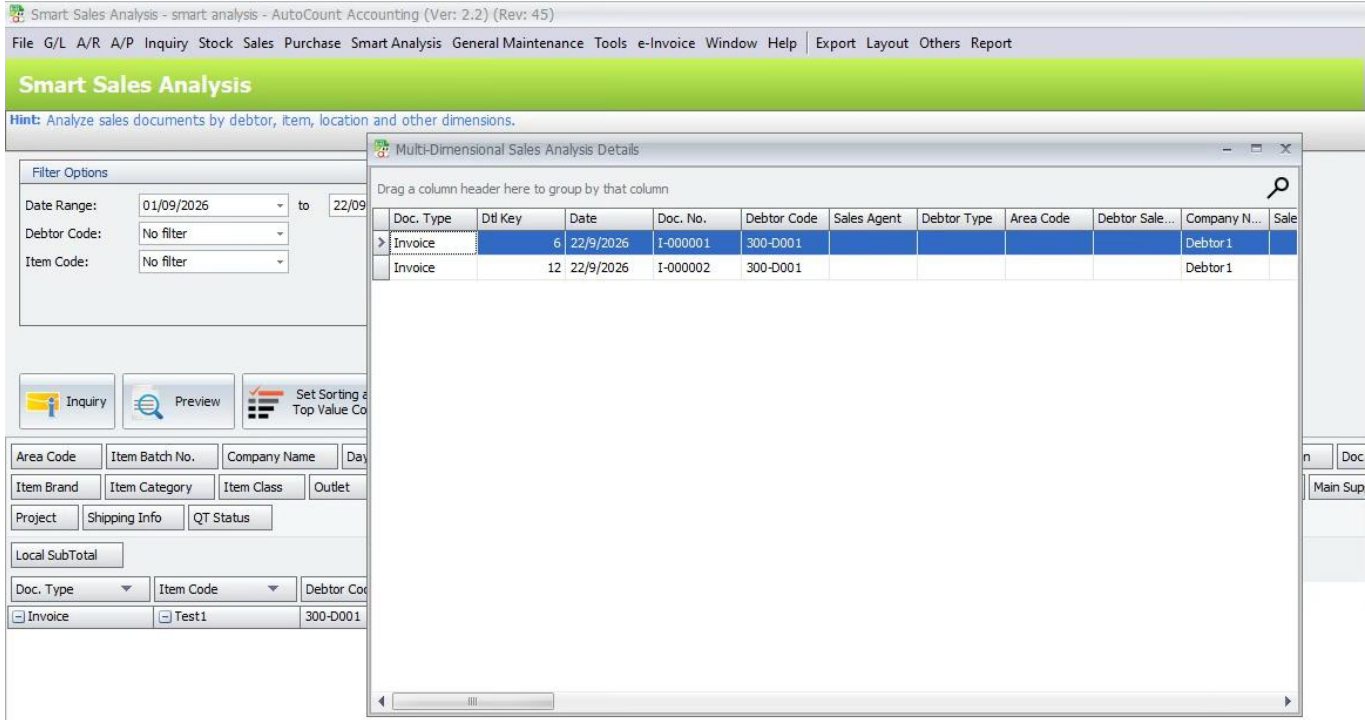
D.3 Drill down to details
Double-click a pivot cell to open the underlying records for that value. The detail list is generated from the selected pivot cell and reflects the report filters.
E. Add User-Defined Fields
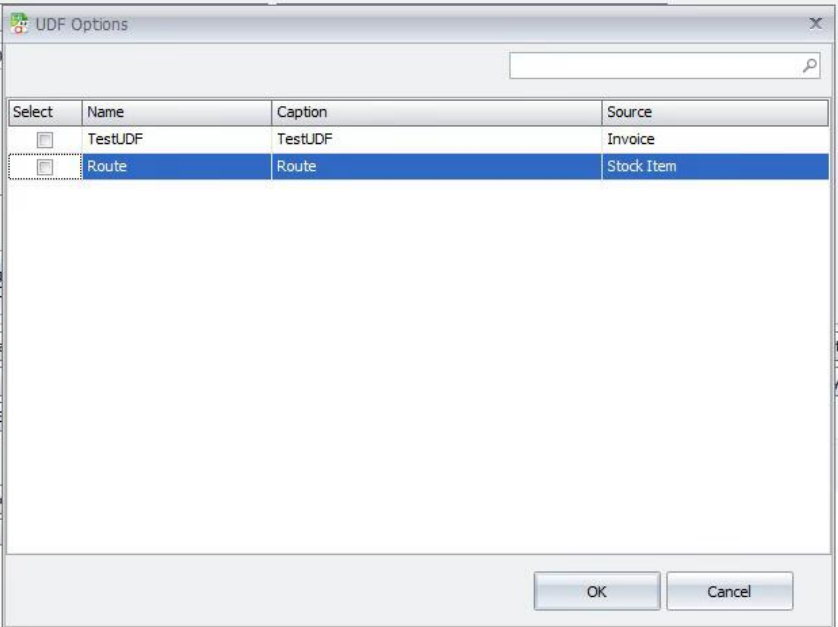
Use UDF to add available user-defined fields to the report layout.
- Click UDF on the Smart Sales Analysis screen.
- Search or scroll the UDF Options list.
- Select the fields to include and click OK.
- Place the new fields in the required pivot area, then review the report. Selected UDF fields become available in the pivot layout. The list is drawn from the fields available to this analysis and company schema.
F. Preview and Export
Preview and export use the current pivot result. Run Inquiry first if the pivot has no results.
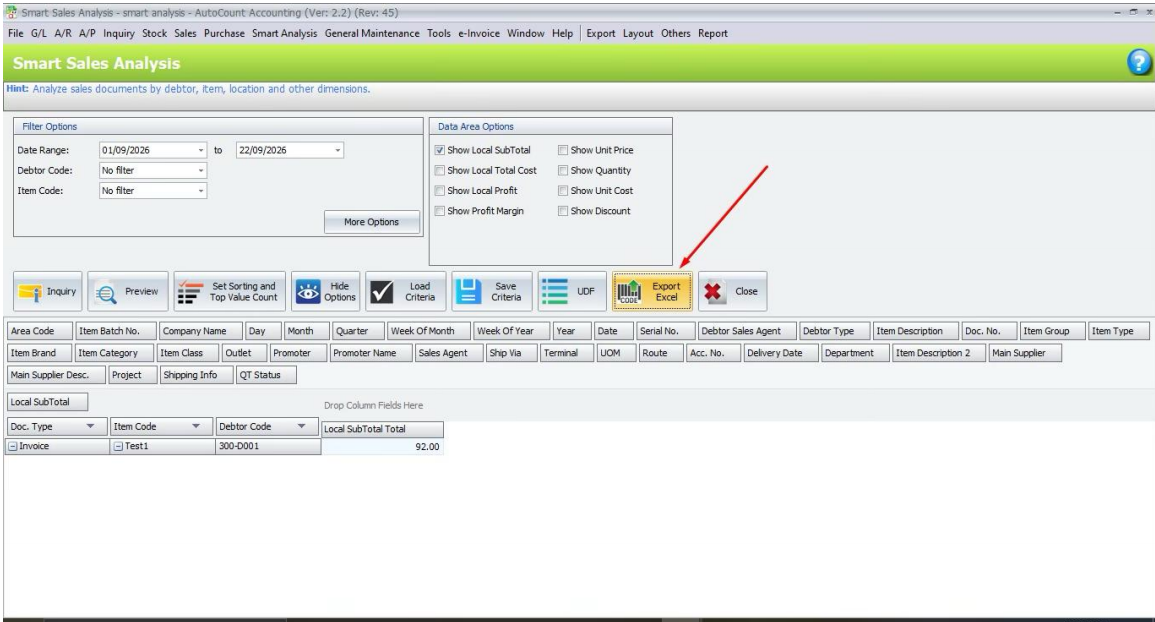
- Click Preview to open the printable report preview.
- To export to Excel, click Export Excel and choose a file name and location for the .xlsx file.
- For other output formats, open the pivot grid’s export menu and select Excel (.xls), PDF, MHT, RTF or Text.
- Review the exported file or preview before sharing it. A preview containing more than 10,000 cells prompts for confirmation before it is created. Preview and export actions require their corresponding access rights.
G. Save and Load Criteria
Saved criteria store the analysis selections and pivot configuration so they can be applied again.
G.1 Save criteria
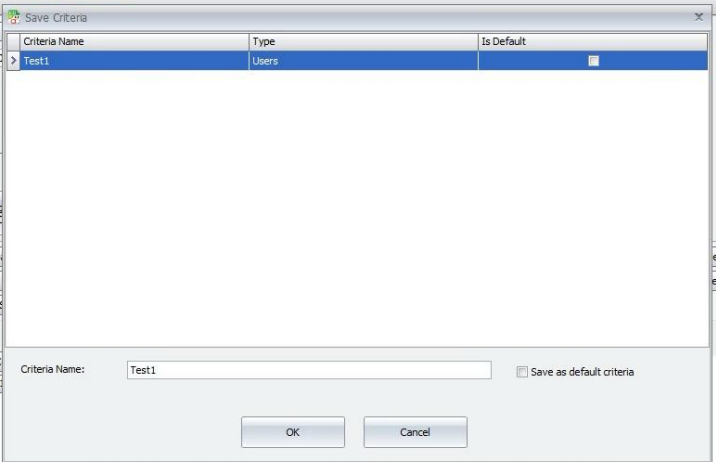
- Set the filters, document types, data areas and pivot layout.
- Click Save Criteria.
- Enter a Criteria Name and save it.
- If the screen offers Is Default, select it only when this criteria should be the default for the user, then confirm the save.
G.2 Load or manage criteria
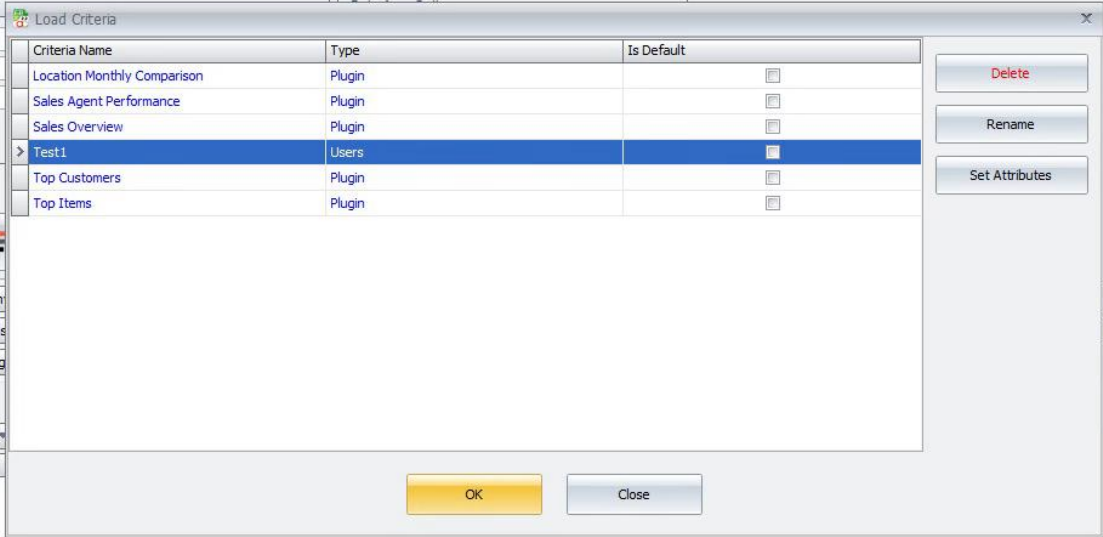
- Click Load Criteria.
- Select a saved criteria row and click OK to apply it.
- Use Rename Criteria or Delete Criteria from the criteria manager when those actions are available.
- Open Set Attributes to review whether the criteria is the default and which users are denied access, then save the attributes. A user can load criteria that is available to that user. Criteria access may be restricted through its deny-user attributes.
H. Manage Analysis Criteria
Users with the AutoCount Customize Grid Layout right can access the analysis criteria management command. It lists criteria and supports user assignments.
- Open Smart Sales Analysis and open the Others menu.
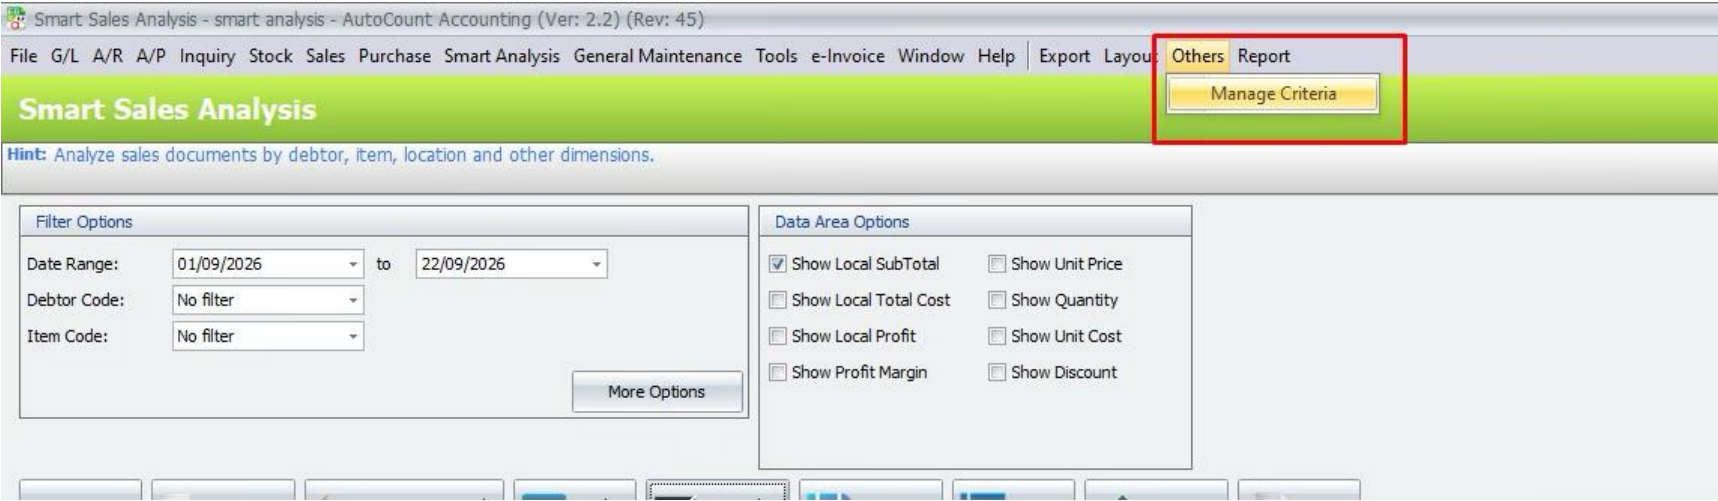
- Select Manage Analysis Criteria.
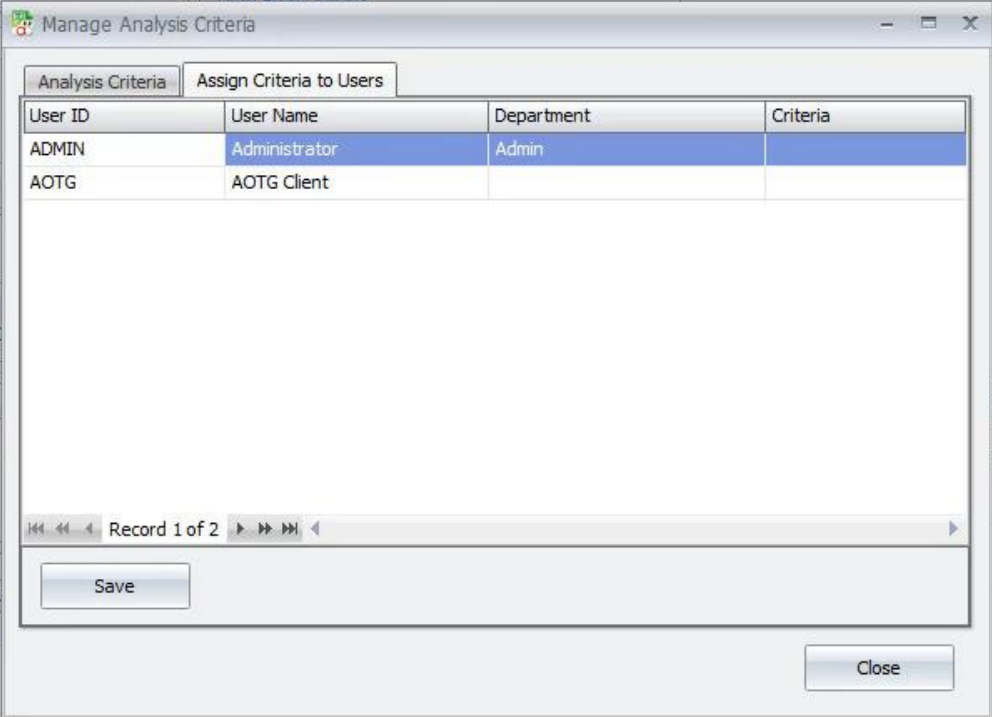
- Review the Analysis Criteria list and the Assign Criteria to Users grid.
- Select the criteria assignments required for each user, then click Save.
- Click Close when the assignments are saved. The manager also provides Delete for a selected criteria. Confirm the selected row before deleting it.
I. Save and Restore a Pivot Layout
Save a pivot layout as an .mds file to reuse its field arrangement.
- Arrange the pivot fields and sorting as required.
- Open the pivot grid’s layout commands and choose Save Layout.
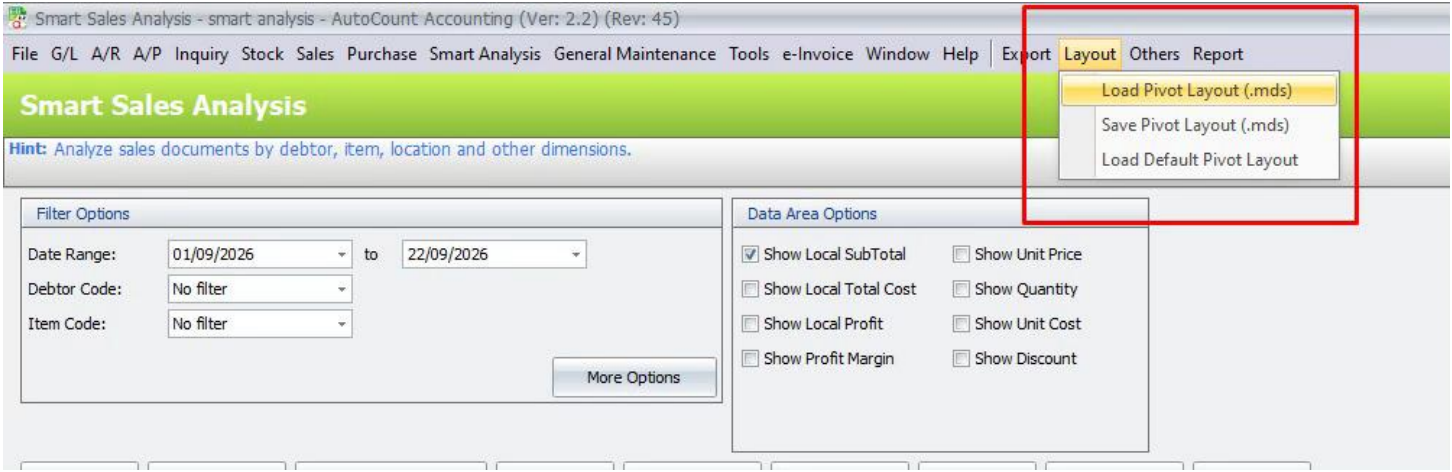
- Choose a location and file name for the .mds layout file.
- To reuse it later, choose Load Layout and select the saved .mds file.
- Choose Load Default Pivot Layout to return to the default arrangement.
Frequently Asked Questions
What does the Smart Sales Analysis Plugin do?
It analyzes sales data through interactive pivot reports that combine multiple sales document types into customizable reports.
How do I run a sales analysis?
Open Smart Sales Analysis, set the date range, select at least one document type and one data area, then click Inquiry to generate the report.
Can I filter the report?
Yes. You can filter by date range, debtor, item, sales agent, currency, location, project, department, item category, brand, class, and other advanced filters.
Can I export the report?
Yes. Reports can be previewed or exported to Excel, PDF, MHT, RTF, and Text formats.
Can I customize the report layout?
Yes. You can rearrange pivot fields, sort results, limit top values, and drill down into transaction details.
Can I save my analysis settings?
Yes. You can save analysis criteria, reload saved configurations, manage user assignments, and restore custom pivot layouts for future use.
Unlock Smarter Sales Insights Today!
Turn sales data into meaningful insights with the AutoCount Smart Sales Analysis Plugin. Analyze sales performance through interactive pivot reports, apply advanced filters, customize layouts, drill down into transaction details, and save reusable analysis criteria—all from one powerful reporting solution.